Does Basecamp Have a Gantt Chart?
The short answer is no. Basecamp does not have a Gantt chart, and it never has. If you are searching for a Basecamp Gantt chart because you want the classic horizontal timeline with task bars, dependency arrows, and a critical path, Basecamp will not give you that out of the box, and no setting turns one on.
This is a deliberate choice by 37signals, the company that makes Basecamp. They have written for years that they think Gantt charts encourage false precision and a kind of planning theater. Whether you agree or not, the practical result is the same: there is no Gantt view to enable. What Basecamp gives you instead is two different tools, Hill Charts and the Schedule, plus a few honest workarounds. Here is what each one does and where it falls short.
What is a Gantt chart, and why do people want one in Basecamp?
A Gantt chart is a timeline view of a project. Each task is a horizontal bar. The bar’s left edge is the start date, the right edge is the end date, and the bar’s length shows duration. Tasks are stacked vertically, time runs left to right, and you can usually draw dependency lines (task B cannot start until task A finishes).
People want a Basecamp Gantt chart for a few specific reasons:
- They want to see, at a glance, what is happening this week versus next month.
- They want to spot when two tasks overlap and compete for the same person.
- They want to show a client or a boss a single picture of the whole plan.
- They are coming from Asana, Monday.com, or Microsoft Project, where the Gantt (or “timeline”) view is a headline feature.
Those are reasonable needs. Basecamp just answers them with different tools rather than a timeline of bars.
Basecamp’s answer: Hill Charts
The closest thing Basecamp has to a “where are we” visual is the Hill Chart. It is not a Gantt chart, and it does not try to be. It answers a different question.
A Hill Chart is a simple hill-shaped curve. You place a dot for each piece of work somewhere on the hill. The left, uphill side means “we are still figuring this out.” The peak means “we now know how to do it.” The right, downhill side means “we are just executing, no more unknowns.” As work progresses, you drag the dot up and over the hill.
The point of a Hill Chart is to show uncertainty, not time. A task can sit on the uphill side for two days or two weeks; the chart does not say. It tells you whether the work still has unsolved problems in it. That is genuinely useful for status updates, because “we’re 60% done” usually means nothing, while “this is over the hill, it’s just grinding now” tells your team something real.
Hill Charts attach to a to-do list. You turn the feature on for a list, add the scopes you want to track, and drag their dots over time. Basecamp even saves snapshots so you can see how a dot moved across the week.
Where Hill Charts fall short of a Gantt chart, honestly:
- No dates. You cannot read a deadline off a Hill Chart.
- No durations. A dot does not tell you how long anything takes.
- No dependencies. Nothing shows that one task blocks another.
- No overlap view. You cannot see two people’s workloads colliding next Tuesday.
If your real question is “when will this be done and what depends on what,” a Hill Chart will not answer it.
Basecamp’s other answer: the Schedule
The second tool worth knowing is the Schedule. Every Basecamp project can turn on a Schedule, which is a calendar. You add events with dates, and any to-do that has a due date shows up there automatically.
The Schedule gives you the time dimension that Hill Charts lack. You can see that the design review is on the 12th and the launch is on the 20th. You can view it by month, and you can subscribe to it from Google Calendar, Apple Calendar, or Outlook.
But a calendar is not a Gantt chart either. The differences that matter:
- A calendar shows dots on days. It does not draw a bar that spans the full duration of a task.
- There are no dependency lines.
- There is no critical path and no automatic “if this slips, everything after it slips” logic.
So between the two, Hill Charts show how sure you are, and the Schedule shows what is due when. A Gantt chart tries to show both at once on a single timeline, and that is the thing Basecamp does not do.
Does any Basecamp add-on give you a real Gantt chart?
This is where I want to be straight with you, because we make a Basecamp extension and it would be easy to overpromise.
Assistant for Basecamp does not add a Gantt chart. We do not draw timeline bars, dependency arrows, or a critical path, and I would not trust any browser extension that claimed to, because the data Basecamp exposes is not built around durations and dependencies in the first place.
What Assistant for Basecamp adds is a different kind of visibility:
- A Kanban board where each of your to-do lists becomes a column, so you can drag work across stages.
- Custom fields (single-select, multi-select, text, number, date) with colored badges, so you can record a target date, a priority, or an owner on any item.
- Tags and statuses on to-dos, cards, and messages.
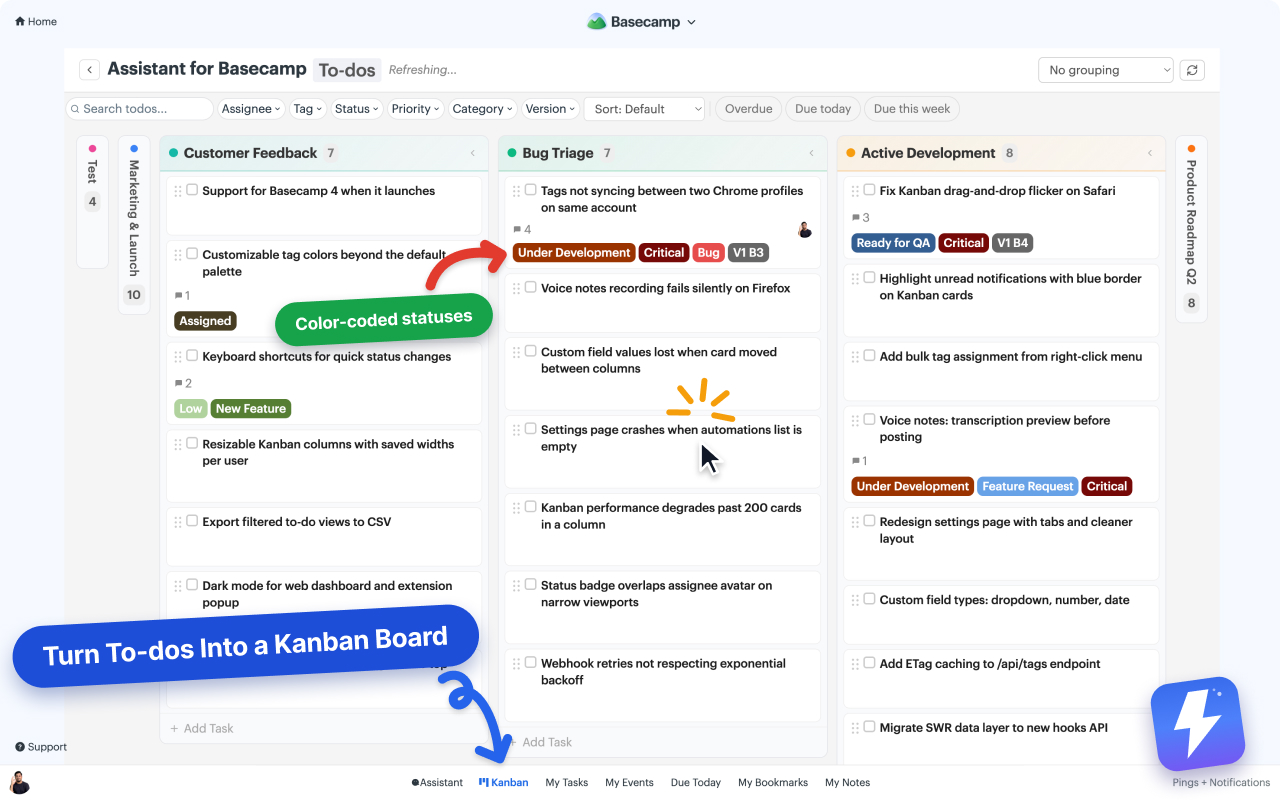
That covers the “I need structure and at-a-glance status” half of why people want a Gantt chart. It does not cover the “I need a timeline with dependencies” half. If a true Gantt is a hard requirement for you, no Basecamp tool or add-on will satisfy it, and you should plan around that rather than hope a workaround appears.
What to do if you genuinely need a Gantt chart
If a horizontal timeline with dependencies is non-negotiable, here are honest options:
- Use Basecamp’s Schedule plus a date custom field. With Assistant for Basecamp you can add a “Target date” field to every to-do, then read your timing off the Schedule. It is not a Gantt, but for many teams “what is due when” is the actual need hiding behind “I want a Gantt.”
- Export to a dedicated Gantt tool. Some teams keep the day-to-day work in Basecamp and maintain a separate timeline in a tool built for it when a client demands one. The cost is duplication: you now keep two plans in sync.
- Reconsider whether you need one. This sounds glib, but it is worth a minute. A lot of Gantt charts are built once for a kickoff deck and never updated. If that is the real use case, a one-page schedule does the job without the upkeep.
For most teams I talk to, the honest answer is option one. Basecamp deliberately avoids Gantt charts because they think detailed long-range timelines tend to be fiction by week three. You may not fully agree, but if you are inside Basecamp already, fighting that philosophy is usually more work than adopting Hill Charts and the Schedule and getting comfortable with them.
Quick recap
- Basecamp has no Gantt chart, and there is no setting to enable one.
- Hill Charts show how much uncertainty is left in a piece of work, not dates or durations.
- The Schedule shows what is due when, like a calendar, with no task bars or dependencies.
- Assistant for Basecamp adds Kanban, custom fields, tags, and statuses, but it does not add a Gantt chart. If you need a true timeline with dependencies, plan to use a separate tool.
If what you actually wanted was a board to move work across stages and fields to track dates and owners, that part you can have. Start with the Kanban help doc or read whether Basecamp has a Kanban view next.